In 2015, total Canadian softwood lumber shipments grew by 9.2% to 26.5 billion bf and U.S. production saw smaller gains, or +1.9% to 32.0 billion bf.
The 20 most important Canadian companies increased production in 2015 (+3.6%), but it was not sufficient to keep paced with the rest of the industry as a result their market share of total Canadian lumber shipments slipped to 74% in 2015 from 80% in 2014.
According to Wood Markets, the decline in market share is clearly an indication of the large Canadian companies consolidating production and retooling mills in anticipation of changes in the log profile and projected tightening or outright reductions in the overall timber supply.
“However,” said Peter Butzelaar, Vice President of Wood Markets,“ the U.S. South is proving to be a strategic pivot option for Canadian producers looking to raise their production and diversify their market and product mix.”
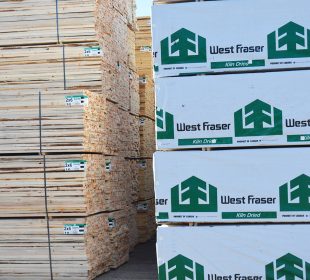
The key attraction to investing in the U.S. South is the region’s more readily available and affordable timber supply with close market proximity. The most active “acquiring” Canadian companies in 2015 were Interfor and Canfor: Interfor increased its U.S. South mill count by three to nine mills, and Canfor added six mills to lift its count in the South to ten. West Fraser, on the other hand, added no new mills in 2015, but did reap benefits from the completion of several capital upgrades in 2014.
The top 5 Canadian producers were Canfor, West Fraser, Tolko, Resolute and Western Forest Products, with the only change in the order from 2014 being Western moving ahead of Interfor.
Canfor retained its lead spot in Canada, increasing its output through capital upgrades by 2.5% to 3.83 billion bf. Maintaining its close second position was West Fraser at 3.60 billion bf (+3.5%) carried higher by a number of capital expansion projects completed in 2014 and the acquisition of the Manning Diversified sawmill in Alberta in 2015. Tolko placed third, with its output rising by 3.9%, this despite cutting production by half at its Quesnel, B.C. mill beginning in late 2015.
On fourth-place, Resolute grew by 5.9% to 1.68 billion bf with the gains primarily coming from the addition of two Ontario sawmills coming online in 2015. Western Forest Products saw its output contract by -1.9% to 891 million bf due to disruptions related to capex upgrades at multiple sawmills in 2015. Interfor’s drop in 2015 production -16.9% to 784 million bf is attributed to a combination of market-related downtime taken by its various Canadian mills as well and the curtailment of the Castlegar mill while it completed a major mill upgrade.
According to Wood Markets, the total lumber shipments of the 20 most important US companies rose by 8.0% to 19.7 billion bf in 2015. This is only the second year in which the collective output of the U.S. top 20 surpassed that of the top 20 Canadian producers. Together, the 20 most important US companies produced 61.5% of all American softwood lumber shipments in 2015, versus 58.0% in 2014. This growth indicates that the largest U.S. producers (including Canadian firms) are continuing with their investment strategies aimed at meeting the anticipated rising demand of the U.S. housing market.
Similar to Canada, the order of the top four companies in the U.S. in 2015 remained unchanged. Weyerhaeuser retained its first-place position increasing by 3.1% to 3.41 billion. Georgia-Pacific remained second, growing by 3.5%. In third place was Sierra Pacific, which grew its production by 4.1% as a result of the rebuilt Quincy mill operating for the full year.
West Fraser stayed in fourth spot, with production up 10.5% to 2 billion bf, reflecting the full-year operation of the two Arkansas sawmills acquired in the first half of 2014, along with operational efficiency improvements. Interfor moved into fifth place with production of 1.7 billion bf — an increase of 38.4% that resulted from additional production generated by two mills acquired from Simpson and one from Price. Although Canfor placed seventh (behind Hampton), it deserves special mention given that its production doubled from 2014 to 1.2 billion bf in 2015 — via a series of acquisitions that raised the former’s mill total from nine to thirteen in the U.S. South.
The top five U.S. firms produced 36.0% (11.5 billion bf) of all U.S. lumber shipments — up from 33.7% in 2014 — while their Canadian counterparts produced 47.8% (11.6 billion bf, down from 45.2% in 2014).
For 2016 the greatest wildcard will be the outcome of ongoing negotiations for the next Softwood Lumber Agreement (SLA). This will be the greatest unknown that the Canadian industry will have to deal with, as a punitive agreement (which can only be expected given the apparent American resolve) will not be good news.
| CANADA TOP SOFTWOOD LUMBER PRODUCERS IN 2015 (Million BF) |
|||||||
| Rank | Company | No. of Mills | Production | % Change | |||
| 2014 | 2015 | 2014 | 2015 | ||||
| 1 | 1 | Canfor | 12 | 3,735 | 3,829 | 2.5% | |
| 2 | 2 | West Fraser | 13 | 3,476 | 3,599 | 3.5% | |
| 3 | 3 | Tolko | 8 | 1,886 | 1,960 | 3.9% | |
| 4 | 4 | Resolute FP | 15 | 1,585 | 1,678 | 5.9% | |
| 6 | 5 | Western FP1 | 8 | 908 | 891 | -1.9% | |
| Total Top 5 | 56 | 11,590 | 11,957 | 3.2% | |||
| Total Top 20 | 104 | 18,877 | 19,566 | 3.6% | |||
| Total Canada | 24,226 | 26,458 | 9.2% | ||||
| Total 5 as a % of Canada Shipments | 47.8% | 45.2% | |||||
| Total 20 as a % of Canada Shipments | 77.9% | 74.0% | |||||
| Notes: Includes lumber produced only at primary sawmills and excludes US production 1 includes custom net volume Source: Wood Markets |
|||||||
| USA TOP SOFTWOOD LUMBER PRODUCERS IN 2015 (Million BF) |
|||||||
| Rank | Company | No. of Mills | Production | % Change | |||
| 2014 | 2015 | 2014 | 2015 | ||||
| 1 | 1 | Weyerhaeuser | 15 | 3,307 | 3,410 | 3.1% | |
| 2 | 2 | Georgia-Pacific* | 17 | 2,266 | 2,345 | 3.5% | |
| 3 | 3 | Sierra Pacific | 12 | 1,951 | 2,031 | 4.1% | |
| 4 | 4 | West Fraser | 15 | 1,817 | 2,008 | 10.5% | |
| 6 | 5 | Interfor | 13 | 1,238 | 1,713 | 38.4% | |
| Total Top 5 | 72 | 10,579 | 11,507 | 8.8% | |||
| Total Top 20 | 131 | 18,225 | 19,691 | 8.0% | |||
| Total Canada | 31,408 | 31,998 | 1.9% | ||||
| Total 5 as a % of Canada Shipments | 33.7% | 36.0% | |||||
| Total 20 as a % of Canada Shipments | 58.0% | 61.5% | |||||
| Notes: Includes lumber produced only at primary sawmills and excludes all Canada and offshore production. *2015 Estimate Source: Wood Markets |
|||||||
[gravityform id="1" title="true" description="true"]
[gravityform id="2" title="true" description="true"]


